What is Multicollinearity?
In multiple regression analysis, when blindly increasing the number of explanatory variables, multicollinearity will occur. This happens when there is a correlation between the explanatory variables then coefficients of the regression equation becomes unstable. When you perform a multiple regression analysis, you need to pay attention to this phenomenon.
Examples of Occurrence of Multicollinearity
First, generate a virtual data using a random number. In the following example, of course, there is a linear relationship between x1~x3 and y, Please further note that you are creating the data that there is a correlation also between the x1 and x3.
x1 <- rnorm(100, 10, 1)
x2 <- rnorm(100, 10, 2)
x3 <- x1 * 2 + rnorm(100, 10, 0.01)
y <-  x1 + 2 * x2 + 3 * x3 + rnorm(100, 0, 1)
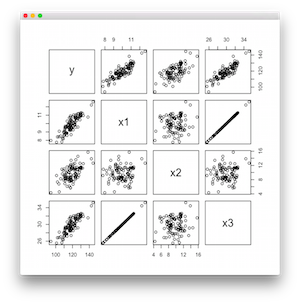
Here you write a scatter plot matrix. You can find that there is a correlation between x1 and x3.
data <- data.frame(y,x1,x2,x3)
pairs(data)
Performs a regression in the lm function then check the summary of the regression.
result <- lm(formula = y ~ x1 + x2 + x3)
summary(result)
It prints like following.
Call:
lm(formula = y ~ x1 + x2 + x3)

Residuals:
     Min       1Q   Median       3Q      Max
-2.33112 -0.82727 -0.06202  0.88366  2.30364

Coefficients:
              Estimate Std. Error t value Pr(>|t|)
(Intercept) -124.64723  119.91432  -1.039    0.301
x1           -23.70632   23.94031  -0.990    0.325
x2             1.96392    0.05202  37.757   <2e-16 ***
x3            15.40270   11.97863   1.286    0.202
---
Signif. codes:  0 ‘***’ 0.001 ‘**’ 0.01 ‘*’ 0.05 ‘.’ 0.1 ‘ ’ 1

Residual standard error: 1.07 on 96 degrees of freedom
Multiple R-squared:  0.9842,	Adjusted R-squared:  0.9837
F-statistic:  1993 on 3 and 96 DF,  p-value: < 2.2e-16
According to the method to make a virtual data, the regression equation should become close to y = x1 + 2 * x2 + 3 * x3, however, we got entirely different coefficients. This is the influence of multicollinearity. The significance of each factor is also not small, it is suggested that regression is not going well.
Discrimination of Multicollinearity by VIF value
If in the explanatory variables might have caused a multicollinearity, we will calculate the VIF (Variance Inflation factor). When it exceeds 10, there will be an impact of multicollinearity. First of all, you can not calculate default of VIF in R, then install the package.
install.packages("fmsb")
library(fmsb)
Once installed, you can calculate the VIF If you enter the command as follows.
VIF(lm(x1~x2+x3))
VIF(lm(x2~x1+x3))
VIF(lm(x3~x1+x2))
It prints like following.
[1] 44614.76
[1] 1.03132
[1] 44621.33
The VIF of x1 and x3 exceeding the 10 shows that there is multicollinearity.